Integrating a commercial scale solar PV system at 11kV
Introduction
Renewable energy generating systems connected to the electricity grid raise significant challenges for network operators. Power generation can change back and forth over short periods of time, creating an imbalance between supply and demand. This can cause directions of power flow1 to change and affect network stability.
This report begins with a short literature review of the background to distributed energy generation. The integration of a new, commercial scale solar PV system, into an existing, large campus, is used as a case study to highlight that the issue of bidirectional power flows can be seen not only in the utility networks, but in large building services too.
1 The terms power flow and load flow are the same and interchangeable in many texts. Although load flow is possibly the more widely used term, this report does not involve per unit voltage levels or voltage phase angles, so the term power flow feels more appropriate here.
Background
Transmission and distribution networks
Often referred to as the national grid, the UK’s electricity system is a series of networks, considered to be composed of two identifiable sections: the transmission network and the distribution network. By analogy, the transmission networks are the motorways for electricity: they carry a huge amount of electricity over long distances, at very high voltages. Distribution networks are analogised as the A-roads and B-roads for electricity: they take electricity from the transmission network at reduced voltages, and route it to the point of use. The entire system is managed by the National Energy System Operator (NESO) who ensure that at any time, the power being generated matches the demand, which is known as balancing the system.[1]
Centralised and distributed generation
Traditionally, the grid was powered by large, centralised generators that connected directly to the transmission network. However, the growth of renewable energy generating systems is changing this paradigm.
Over the past year, 30% of the demand on Great Britain’s national grid was generated from wind, with 6% from solar PV.[2] Most wind generation in Great Britain is from large, offshore wind farms in the North Sea. Typically however, renewable energy generating systems are smaller, often connected into the distribution network close to load centres, and in the case of solar PV and wind generation, the output is inherently variable. They are broadly distributed rather than centralised.[3]
Bidirectional power flows
With centralised generation, power flows are in one direction, from the centralised generator to the built environments (the loads) consuming the power.
With increased penetration of distributed, renewable energy generators (DREG), however, the variable output can cause supply to exceed the demand of local load centres. When this happens, net power flow is away from local load centres rather than towards them. The flow of power on the grid becomes bidirectional, which can cause protection and stability issues.[4]
Balancing and stability
Bidirectional power flows make balancing the system much more difficult. An imbalance between generation and demand on the grid creates frequency and voltage stability issues.[3] To meet these challenges, the network operators have introduced regulations which must be met by generating systems that connect to the grid.[5][6]
Integration of solar PV into a MV network
Solar PV systems connect into the grid via power electronics: an inverter. A voltage source converter can control both active and reactive power. Although to a much lesser extent than a conventional induction generator, the system will increase the fault current. Successful integration to a MV network requires protection, load flow, and short-circuit fault level studies.[4]
Case study
Description
A new, commercial scale solar PV system is to be integrated into the existing 11kV electrical infrastructure of a large, campus building. A software model of the site was built, which is used for analysis. The focus here is on the power flows, with and without the solar PV system, where the "bidirectional" power flow issue is illustrated. The technical studies required by network operators[5][6] are outside of the scope of this report.
Existing site
A primary, on-site, 33/11kV substation is owned by the DNO, and supplies the private, site-wide 11kV network via two feeders. There are eight load centres, supplied from 11/0.4kV, 1MVA transformers. A schematic of the site, as modelled, is shown in Figure 1. The loads are detailed in Table 1.
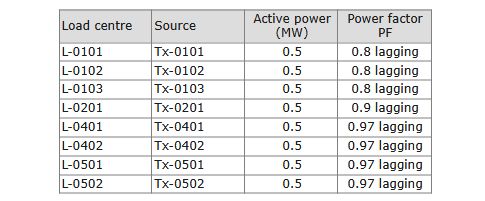
Table 1 – Site load centres.
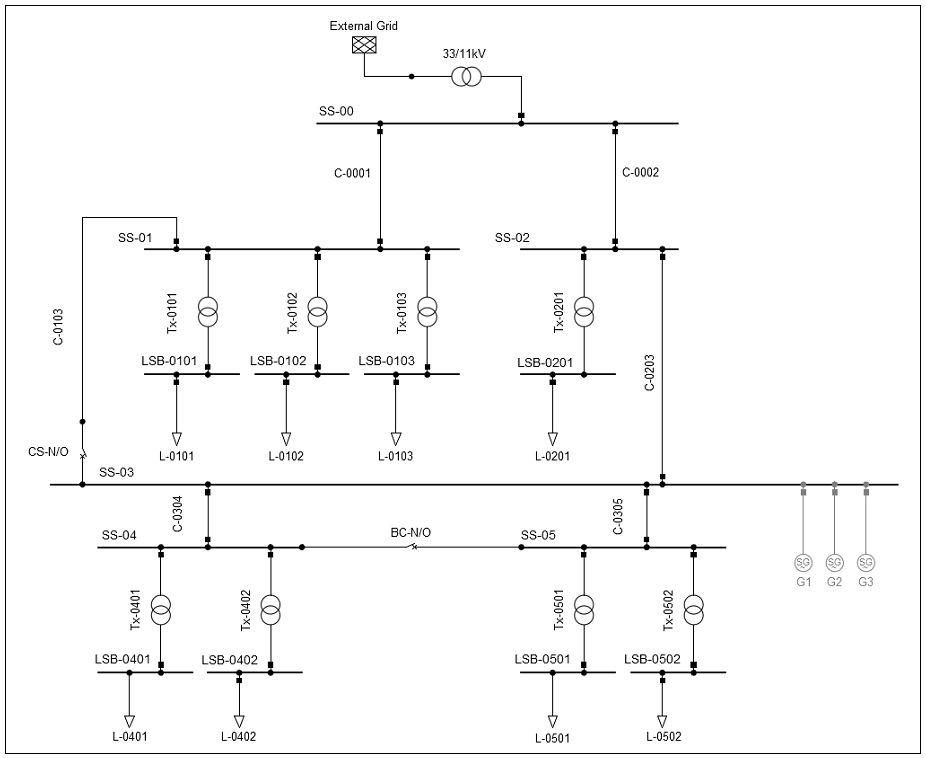
Figure 1 – Existing site schematic.
New solar PV arrays
Two solar PV systems were planned. If operating at a power factor (PF) of 1, array PV-01 has a maximum capacity of 1.7 MVA, while array PV-02 has a maximum capacity of 1.1MVA. It is planned to operate the inverters at PF = 0.95 inductive. The outputs for active power generation, P, and reactive power generation, Q, are calculated from the equations shown in Figure 5, and are shown in Table 2. System PV-012 is the combined systems PV-01 and PV-02.
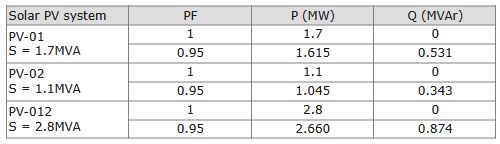
Table 2 – Power outputs from the solar PV systems. S is the maximum output from the PV array. P and Q are calculated from Figure 5.
Power flow results
The convention used by the software is that, for a transformer or cable, the power is given as +ve if flowing out of a node, and -ve if flowing into a node and towards a generator. For a generator (here, the grid or solar PV systems), the power is given as +ve if flowing into a node, and -ve if flowing out of a node. Tables 3-5 show the magnitudes of P and Q flowing in the areas of interest, as calculated in the model. Figures 2-4 show the direction of power flow graphically. In all cases, the solar PV systems are generating full power, with a power factor PF = 0.95 inductive (that is, generating Q).
With no DREG

Table 3 – Power flows in existing infrastructure with no DREG, as calculated by the model.
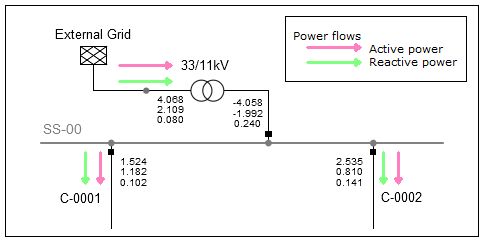
Figure 2 – Power flows with no DREG.
With two DREGs at a single connection point
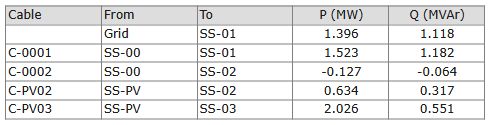
Table 4 – Power flows with 2.8MVA DREG at SS-PV, as calculated by the model.
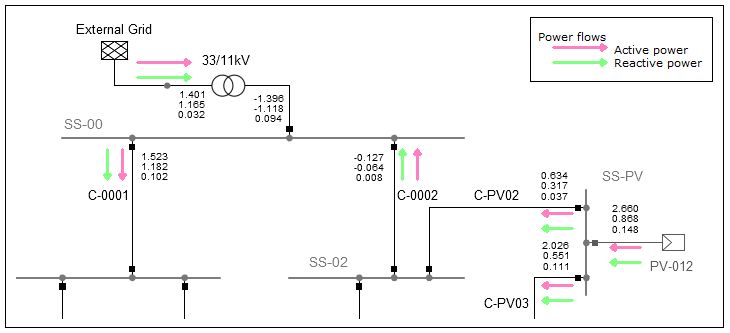
Figure 3 – Power flows with DREG at SS-PV.
With two DREGs at separate connection points
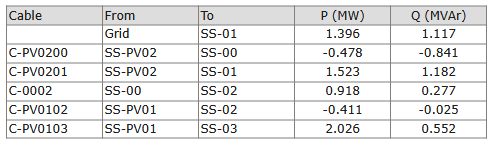
Table 5 – Power flows with 1.7MVA DREG at SS-PV01 and 1.1 DREG at SS-PV02, as calculated by the model
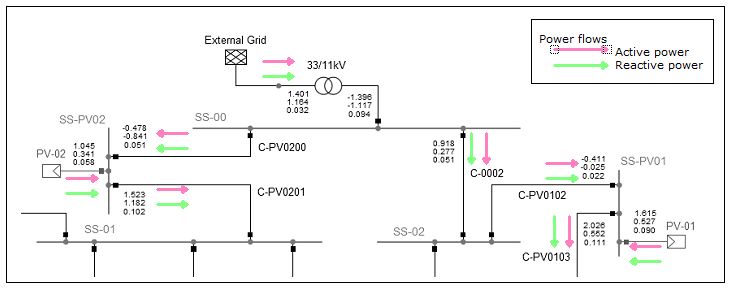
Figure 4 – Power flows with DREG at SS-PV01 and SS-PV02.
Discussion of results
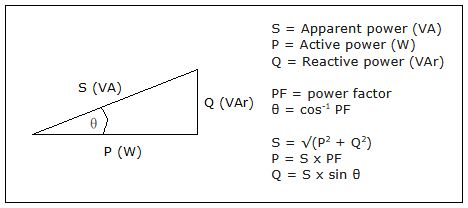
Figure 5 – Formulas for power calculations, based on the power triangle.
Grid to installation with no DREG
It can be seen from Figure 2 that in the existing system, with no DREG, the power flows in the two main 11kV feeder cables, C-0001 and C-0002, are from upstream to downstream: the grid is supplying both active power (P) and reactive power (Q) into the installation. All load centres have lagging power factors and are consuming Q, which is being supplied by the grid. A calculation for C-0001 using the formulas in Figure 5 gives:
Load supplied is 3 x 0.5MW at PF 0.8 lagging
P = 0.5 x 3 = 1.5MW
S = P / PF = 1.5 / 0.8 = 1.875MVA
Q = S x sin (cos-1 (0.8)) = 1.875 x sin (36.87) = 1.125MVAr
Allowing for losses of both P and Q in the transformers Tx-0101/2/3, there is a high degree of confidence in the model as the results in Table 3 are inline with the 'sanity-check' calculations above.
Observing bidirectional power flow
Two options were investigated for the integration of the solar PV systems. The first option was to connect both systems at a single connection point, SS-PV. Cable C-0203, shown on Figure 1, original length 250m, would be removed and replaced by new cables C-PV02 and C-PV03, each cable 360m long. The arrangement was modelled and is shown in Figure 3, where PV-012 is rated at 2.8MVA, being the sum of the two systems. With PV-012 set at PF 0.95 inductive (that is, generating Q) and maximum output, Figure 3 shows that power is flowing towards SS-00 through cable C-0002. This will continue to be the case until the output from PV-012 falls (due to cloud cover or sunset) to less than the sum of the loads L-0201, L-04xx and L-05xx, as listed in Table 1. Protection of cable C-0002 is therefore an issue. At a building services level, it demonstrates the issue of bidirectional power flow seen at the distribution network level, as highlighted in the literature review.
Preventing bidirectional power flow
The second option was to connect the two solar PV systems individually: PV-01, rated at 1.7MVA, at SS-PV01, and PV-02, rated at 1.1MVA, at SS-PV02. The arrangement was modelled and is shown in Figure 4. PV-01 was connected between SS-02 and SS-03 in the identical arrangement as detailed above. PV-02 was connected at SS-PV02 by breaking into the original cable C-0001 at its midpoint: original, total length 320m.
At full power and PF 0.95 inductive, PV-02 output is less than the sum of the load centres L-01xx. This means that whether the output from PV-02 is maximum or zero (at night), the power flow in cable C-PV0200 will always be in the direction as shown on Figure 4: the grid will always supply P and Q to the loads L-01xx.
At full power and PF 0.95 inductive, as shown in Table 2, PV-01 generates less than the sum of the load centres L-0201, L-04xx and L-05xx. Figure 4 shows that the direction of power flow in cable C-0002 is from SS-00 to SS-02 as the grid supports PV-01 to supply the load L-0201. It can therefore be deduced that the power flow in cables C-0002 and C-PV0102 will always be in the direction shown, whether PV-01 is generating full power or zero power. This is desirable and is the option selected for installation. The final site schematic is shown in Figure 6.
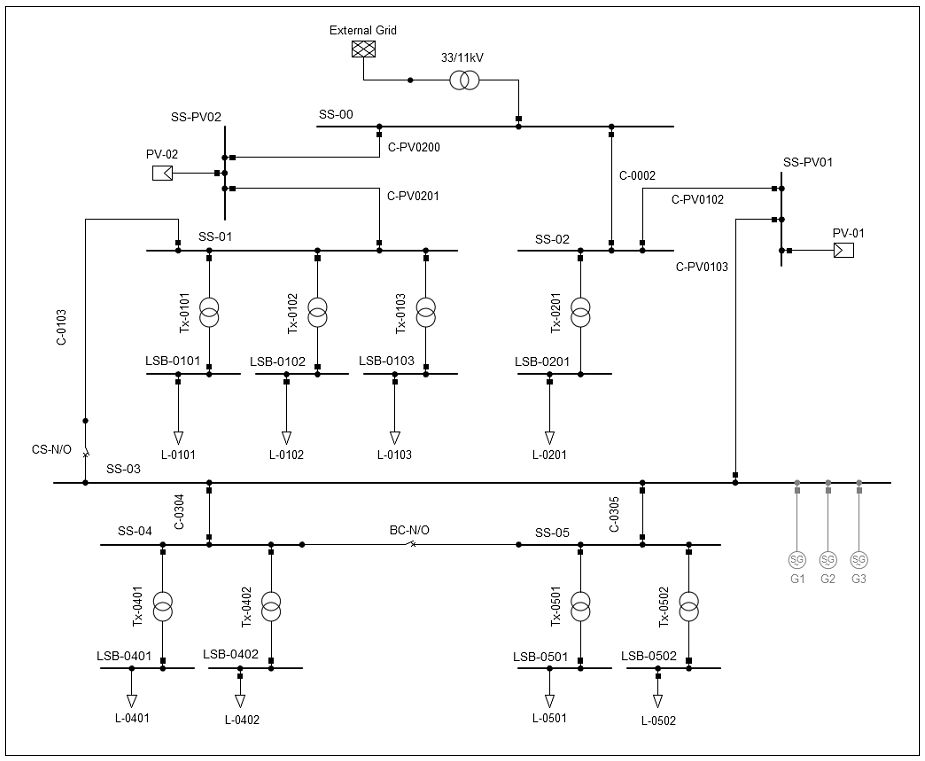
Figure 6 – Site schematic with DREG, as installed.
Conclusions
Distributed, renewable energy generators present challenges for utility network operators. The case study shows that similar challenges exist in building services. Substantial renewable energy systems integrated into large, commercial buildings can create bidirectional power flows, and hence protection issues, in the electrical installation. Software modelling at the design stage should be used to analyse the system and eliminate potential issues.
References
[1] Energy Networks Association. Energy networks explained. Website: energynetworks.org [Accessed 04.10.25]
[2] National Grid Live. Website: grid.iamkate.com [Accessed 04.10.25]
[3] BCG Henderson Institute. Rising to the Challenges of Integrating Solar and Wind at Scale. 2021
[4] Bayliss, C., Hardy, B. Transmission and Distribution Electrical Engineering. Ch. 23.6. Elsevier, 2012.
[5] National Energy System Operator. The Grid Code. 2025.
[6] Energy Networks Association. Engineering Recommendation G99. 2025.
Contact
Enquiries are welcome from M&E contractors, consultants and renewable energy system developers.
How can we support you with your electrical design tasks?
Contact details here ...
